
Tracing
@keryxjs/tracing adds OpenTelemetry distributed tracing to your Keryx app. It exports OTLP spans for HTTP requests, action executions, background task enqueue/execute, Redis commands, and Drizzle DB queries — and propagates W3C trace context across service and process boundaries.
For metrics, see the built-in Observability feature — that ships with the core framework. This plugin is tracing-only.
Quick Start
Install the package and register it in your plugins config:
// config/plugins.ts
import { tracingPlugin } from "@keryxjs/tracing";

export default {
  plugins: [tracingPlugin],
};
Enable tracing and point at an OTLP HTTP receiver:
OTEL_TRACING_ENABLED=true OTEL_EXPORTER_OTLP_ENDPOINT=http://localhost:4318 bun run startLocal Testing with Jaeger
The repo ships a one-container OTLP receiver + UI for local development. Jaeger's all-in-one image accepts OTLP/HTTP on port 4318 (matching the plugin's default endpoint) and serves its web UI on port 16686 — no OTel Collector needed.
Run all commands below from the repo root.
Start Jaeger:
docker compose -f packages/plugins/tracing/docker-compose.tracing.yaml up -dRun the example backend with tracing enabled:
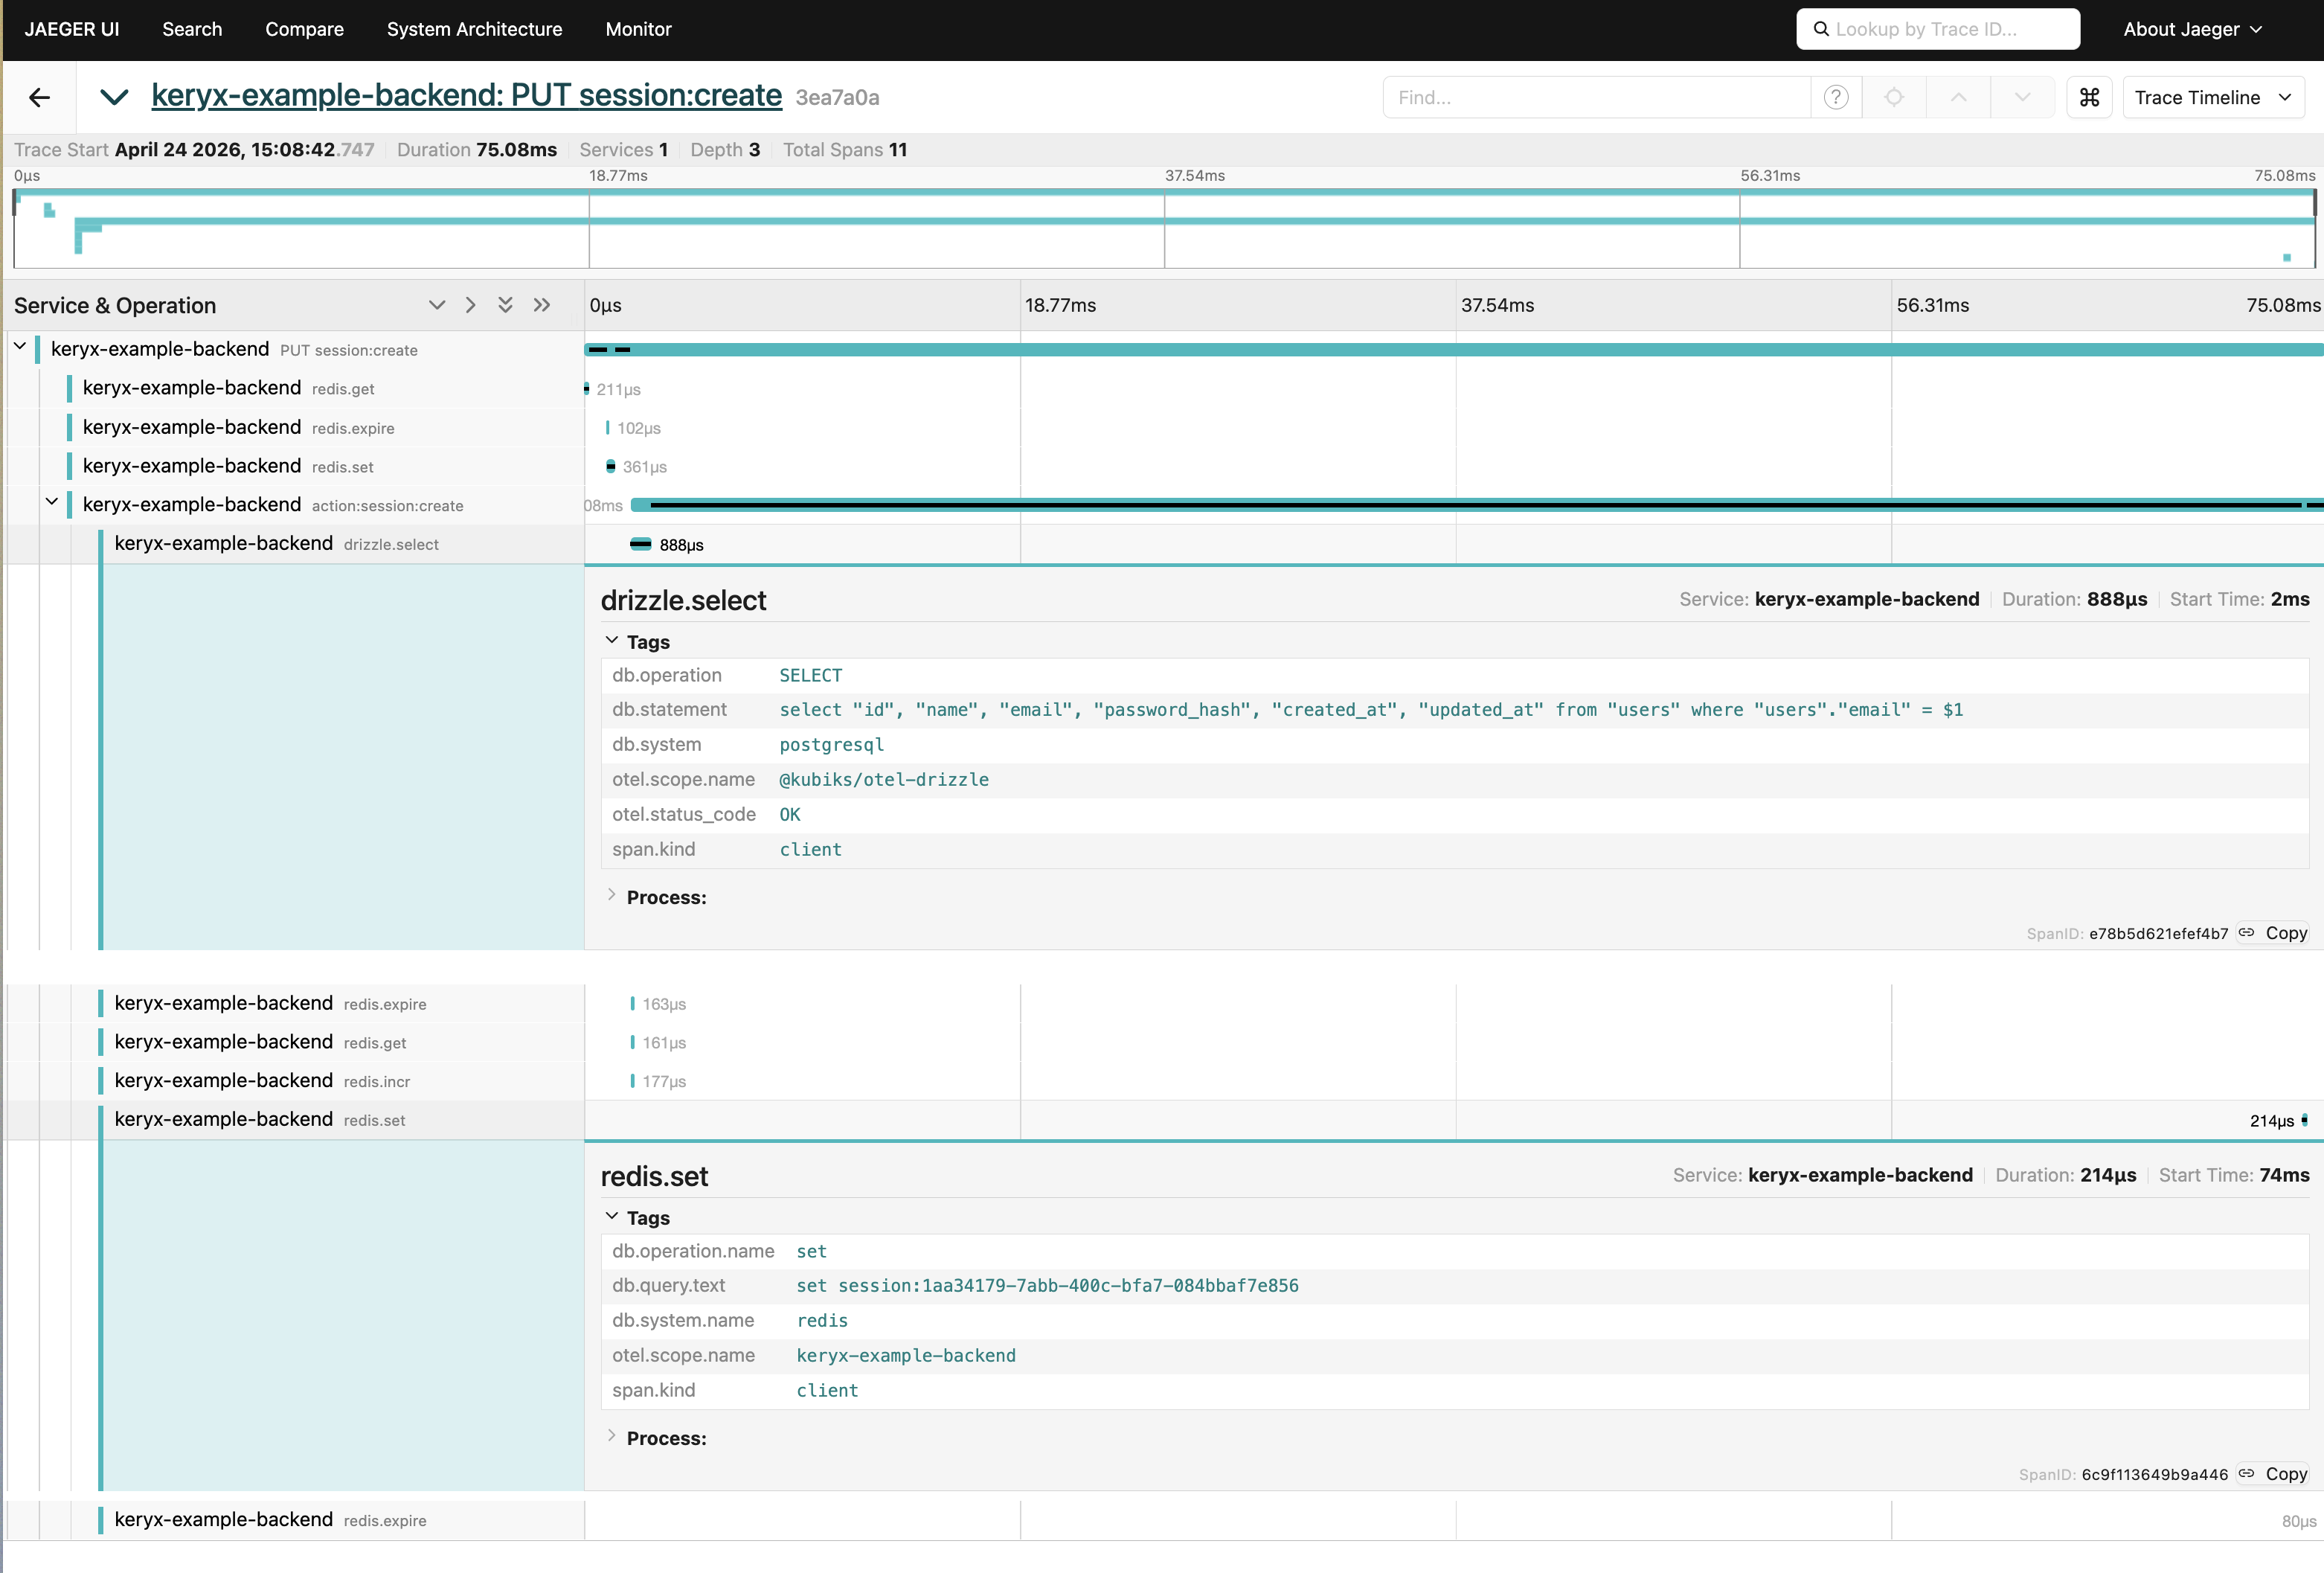
OTEL_TRACING_ENABLED=true bun devOpen the UI at http://localhost:16686, pick keryx-example-backend (or whatever OTEL_SERVICE_NAME resolves to) in the service dropdown, and click Find Traces. A request to /api/status will show an HTTP span parenting an action:* span; actions that touch Redis or Postgres will show redis.* and drizzle.* children.
Tear it down when you're done:
docker compose -f packages/plugins/tracing/docker-compose.tracing.yaml downJaeger all-in-one is memory-backed — traces are lost on container restart. This is intentional for dev; don't use it for production trace storage.
Configuration
The plugin adds its own config.tracing.* namespace. All keys can be set via env vars at startup.
| Config Key | Env Var | Default | Description |
|---|---|---|---|
tracing.enabled | OTEL_TRACING_ENABLED | false | Master toggle for tracing |
tracing.otlpEndpoint | OTEL_EXPORTER_OTLP_ENDPOINT | "http://localhost:4318" | OTLP HTTP receiver (Jaeger, Tempo, Honeycomb, Datadog…) |
tracing.sampleRate | OTEL_TRACING_SAMPLE_RATE | 1.0 | Head-based sampling ratio (0–1) |
tracing.spanQueueSize | OTEL_SPAN_QUEUE_SIZE | 2048 | Max spans buffered before dropping |
tracing.spanBatchSize | OTEL_SPAN_BATCH_SIZE | 512 | Max spans per export batch |
tracing.spanExportDelayMs | OTEL_SPAN_EXPORT_DELAY_MS | 5000 | Delay between scheduled batch exports |
tracing.spanShutdownTimeoutMs | OTEL_SPAN_SHUTDOWN_TIMEOUT_MS | 5000 | Timeout for flushing pending spans on shutdown |
observability.serviceName | OTEL_SERVICE_NAME | (app name) | Service name set on all spans (shared with core metrics) |
What Gets Instrumented
| Span name | Kind | Attributes | Notes |
|---|---|---|---|
<METHOD> / GET status | SERVER | http.request.method, http.response.status_code, http.route, url.full | Renamed to <METHOD> <route> once the action resolves |
action:<name> | INTERNAL | keryx.action, keryx.connection.type, keryx.action.duration_ms | Fires for every action across all transports (HTTP, WS, task, CLI, MCP) |
redis.<command> | CLIENT | db.system.name="redis", db.operation.name, db.query.text | db.query.text is <command> <key1> <key2>… — keys only, values are never captured (so AUTH passwords, SET values, etc. stay out of traces) |
drizzle.* | CLIENT | db.system="postgresql", db.statement (up to 1000 chars) | Provided by @kubiks/otel-drizzle |
Spans nest naturally: the HTTP span is the parent of the action span, which is the parent of any Redis / Drizzle spans emitted during the action.
Distributed Context Propagation
The plugin uses the W3C Trace Context standard:
- Incoming HTTP: reads
traceparent/tracestateheaders and links the request span to the caller's trace. - Outgoing tasks: injects
traceparent/tracestateinto background task params, so a worker picking up a job continues the originating trace. - Task execution: extracts the propagated context before running the action, so task spans are children of the enqueuer's trace.
Programmatic Access
The plugin exposes api.tracing for manual instrumentation from action code:
import { api } from "keryx";
import { SpanKind, SpanStatusCode } from "@opentelemetry/api";

const span = api.tracing.tracer.startSpan("my.custom.work", {
  kind: SpanKind.INTERNAL,
});
try {
  // …
  span.setStatus({ code: SpanStatusCode.OK });
} catch (e) {
  span.recordException(e as Error);
  span.setStatus({ code: SpanStatusCode.ERROR });
  throw e;
} finally {
  span.end();
}
When tracing is disabled, api.tracing.tracer returns a no-op tracer — startSpan() is cheap and calling span methods does nothing, so you can leave instrumentation in place with no runtime cost.
How It Works
The plugin is fully hook-based — it does not modify core Keryx code. It registers:
api.hooks.web.beforeRequest/afterRequest— create and finalize the HTTP spanapi.hooks.actions.beforeAct/afterAct— create and finalize the action spanapi.hooks.actions.onEnqueue— inject trace context into task paramsapi.hooks.resque.beforeJob— extract trace context when a worker picks up a task
The plugin also wraps api.redis.redis.sendCommand and attaches @kubiks/otel-drizzle to api.db.db after those initializers run.
Because everything runs through hooks and the OTel global APIs, you can mix-and-match — register your own span processors, swap the exporter, or install custom propagators — and Keryx's instrumentation will continue to work.
